
Anything can be measured. If something can be observed in a way at all, it lends itself to some type of measurement method. No matter how fuzzy the measurement is, it’s still a measurement if it tells you more than you knew before”
— Douglas Hubbard
If you’re a management-level SEO or marketing professional, you’re likely making MANY decisions on a daily basis with imperfect information.
That inevitability is part of the game you’re playing.
To make better and more informed decisions, your goal should be to reduce uncertainty in the decision-making process. What’s the best way to do that?
Measurement.
Measurement is simply a reduction in uncertainty that is conveyed quantitatively and based on at least one observation.
When it comes to digital PR (i.e., link building), there’s no exact science for measuring ROI.
From an ROI reporting perspective (i.e., calculating ROI after the fact), it’s impossible to hold all other variables constant except the links you build.
From an ROI forecasting perspective (i.e., predicting what the ROI might be), it’s impossible to know exactly what links to build and what the resulting revenue gains from those links will be.
Does that mean you should abandon any attempt at calculating a return?
No.
By failing to calculate a return on link building, you’re ignoring the fact that there are techniques available that reduce the uncertainty in determining if link building can provide your organization with a positive return.
In this post, I’ll cover the two mistakes I see organizations making when determining link building investment, what a Monte Carlo simulation is, what Fermi decomposition is, and how to use a Monte Carlo simulation to model the return on link building.
Link Building Investment Mistakes
There are two common mistakes I see organizations make regarding their link building investment.
Mistake #1
“I can’t measure the exact ROI on link building, so I’m not going to engage or invest in link building.”
— Lazy Marketing Manager
Backlinks are crucial to driving organic traffic from Google’s search engine results page to your website. Even Google said backlinks are one of their algorithms' top three ranking factors.
This mistake is costly because you end up missing out on ALL the upside that link building could bring you.
One thing is for certain: If you don’t build backlinks, you aren’t going to increase revenue from organic search.
Mistake #2
“To increase organic traffic to our website, we need to acquire backlinks, so I’m going to build as many backlinks as I can.”
— Some Old School SEO
This methodology usually is accompanied by a lack of any coherent strategy. Throwing shit against a wall to see what sticks is an extremely ineffective way of accomplishing something.
It’s also costly from both a time and financial perspective.
You might get lucky here and there, but in the long run, you can guarantee a waste of resources and an increased risk of getting penalized by Google.
So, what’s the correct path forward? How do you ensure you're not making these mistakes?
By utilizing data and business intelligence techniques.
A Simple Assumption about Organic Traffic
Before you begin calculating the return on link building, it’s important to understand an assumption you’ll be making.
When you invest in organic search traffic acquisition, your ROI will usually increase over time.
Why?
Once you are ranking, the resources you need to invest to keep ranking are usually MUCH less than the resources it took to begin ranking in the first place.
When you first begin link building, you’ll need to close the link gap between your site and your competitor’s. The link gap is the difference in the number of backlinks between your site and the competitors ranking for the keywords you want to rank for.
The bulk of your investment will be in closing this link gap.
Once that gap is closed, you just need to ensure your link velocity is greater than or equal to your competition’s, which is usually much cheaper to maintain.
When you calculate the ROI on link building, I recommend calculating it over at least twice the amount of time you think it will take to close the link gap.
For example, let’s say you think you can close the link gap in 6 months. You’d want to measure ROI over 12 months or more.
The assumption we’ll be using when calculating ROI on link building is that ONLY once you close the link gap will you begin generating revenue attributed to organic traffic.
In reality, you’ll likely see benefits from link building way before you close the link gap, but for the purposes of forecasting ROI, it’s best to use this assumption so you know you’re underestimating the return.
If the ROI is still positive AND you know you’re underestimating it, you should feel good about your link building investment. I’ll show you where this assumption comes into play when we start building the model below.
What is a Monte Carlo Simulation?
"Monte Carlo simulations are used to model the probability of different outcomes in a process that cannot easily be predicted due to the intervention of random variables. It is a technique used to understand the impact of risk and uncertainty in prediction and forecasting models."
— Investopedia
A Monte Carlo simulation is a powerful statistical method you can use when you need to make an estimate or forecast where there is significant uncertainty (i.e., calculating the ROI on link building). The simulation creates tens of thousands (or millions) of different random scenarios and then provides you with the probability of various outcomes.
In the Google Sheets template I provided, I’m running 10,000 different scenarios in the simulation, but if you want to run 1,000,000 or even 10,000,000, you can easily rebuild the logic into a Python script.
What is a Fermi Problem?
A Fermi problem “is an estimations problem designed to teach dimensional analysis or approximation of extreme scientific calculations, and such a problem is usually a back-of-the-envelope calculation.”
Fermi decomposition is the term used to describe the approach to solving Fermi problems. To teach Fermi decomposition, Enrico Fermi (the originator of the Fermi problem) used to ask his students to estimate the number of piano tuners (i.e. people that tune pianos) in Chicago. The only information he’d give them was the population size of Chicago.
Thanks to NASA, here’s the explanation of the problem:
As a lecturer, Enrico Fermi used to challenge his classes with problems that, at first glance, seemed impossible. One such problem was that of estimating the number of piano tuners in Chicago given only the population of the city. When the class returned a blank stare at their esteemed professor, he would proceed along these lines:
From the almanac, we know that Chicago has a population of about 3 million people.
Now, assume that an average family contains four members so that the number of families in Chicago must be about 750,000.
If the average piano tuner serviced four pianos every day of the week for five days, rested on weekends, and had a two-week vacation during the summer, then in one year (52 weeks) he would service 1,000 pianos. 150,000/(4 × 50) = 150, so that there must be about 150 piano tuners in Chicago.
This method does not guarantee correct results; but it does establish a first estimate which might be off by no more than a factor of 2 or 3--certainly well within a factor of, say, 10. We know, for example, that we should not expect 15 piano tuners or 1,500 piano tuners (a factor of 10 error, by the way, is referred to as being 'to within cosmological accuracy.' Cosmologists are a somewhat different breed from physicists, evidently)!
We can apply the concept of Fermi decomposition to link building and use it to help us estimate ROI.
For example, let’s say you are estimating what your revenue per visit (RPV) is from organic traffic.
If you’re tracking everything appropriately, you should know your current RPV (let’s say it’s $0.20).
Now, we know that the RPV could either increase, decrease, or stay the same, but by how much? Ask yourself, could the RPV drop to $.10? Maybe. What about $0.01. Definitely not. If you looked at your RPV historically, maybe the lowest it's ever been is $0.12. Armed with this information, you’d be VERY surprised if RPV went any lower than $0.05, so you’ll use that as your lower bound.
Next, to find the upper bound, could you see RPV reach $0.50? Possibly, what about $5? No, that would be too high based on the products you sell and the traffic potential you know you have available. Historically, the highest your RPV has ever been was $0.45. Using $0.60 as your upper bound wouldn’t be unreasonable.
Now we know the range for RPV is $0.05 to $0.60. By deconstructing the problem using the data you have available, some common sense, and Fermi decomposition, you can, with reasonable accuracy, estimate a range for your inputs.
You will want to use this approach to estimating ranges when you build out your Monte Carlo simulation below.
Using a Monte Carlo Simulation to Calculate Link Building ROI
The formula for ROI on link building is simple:
- Net Return on Link Building / Cost of Link Building
The hard part is determining what the inputs are that go into the numerator and denominator.
Those inputs are:
- Months to calculate ROI over
- Traffic Potential (Per Month)
- Revenue Per Visit (RPV)
- Links Needed To Close Domain Authority Gap
- Link Gap Closing Speed (In Months)
- Cost Per Link
- Link Velocity (Per Month)
Step 1: Calculate a Range Interval for Traffic Potential
If you don't know how to calculate traffic potential, click that link for a separate article I wrote about it (template included).
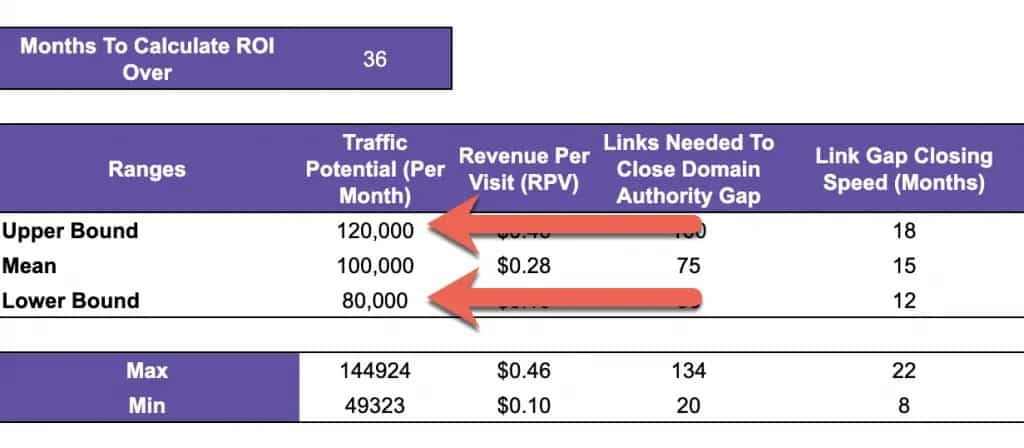
The template will output two numbers: a lower bound and an upper bound for traffic potential.
Plug these values into cells B10 and B12 on the link building ROI template:
Step 2: Determine Your Revenue Per Visit Interval
There are two methods I'll provide you for calculating revenue per visit (RPV). The method you choose will depend on the amount of data you have available to you.
If you're a well-established SAAS or e-commerce company with trustworthy historical sales and website data, use method one. Otherwise, use method two below.
Method 1
Calculate your current revenue per visit (RPV) using the following formula:
If you use a tool like Bizible for marketing attribution, I (usually) recommend using a U-shaped attribution model when calculating the numerator. If not, just use the Google Analytics segment for Organic Traffic and then calculate all revenue you can attribute back to that traffic type.
Now that you have your current RPV, use Fermi decomposition to estimate the lower and upper bound for RPV.
I recommend plotting your RPV by month to see the lowest it has been over the last couple of years and then using that as your gauge.
Add your lower and upper bound into the template into cells C10 and C12:

Revenue per visit in this Monte Carlo simulation is usually the value with the highest level of uncertainty.
For example, if you're an e-commerce company, you may under-represent your RPV because a higher percentage of your current traffic may be top-of-funnel blog-related traffic.
When you start building links and ranking for more product pages, you'll see RPV increase because a higher percentage of the traffic is bottom of the funnel.
The opposite would be true if your product pages already rank well and you focus your new links on blog posts. You may increase your revenue and profits, but at the same time, RPV may decrease because although the blog traffic is incrementally profitable, a lower percentage of that traffic will result in revenue.
After you calculate your lower and upper bounds, use your best judgment, given the information you have to ensure that you are 90% confident the actual RPV will lay somewhere between the lower and upper bound.
Method 2
If you aren’t a well-established e-commerce or SAAS company, you may not trust your RPV number or have any data to use to calculate RPV.
Instead, what you can do is first tag each page on your website as top, middle, and bottom of funnel. Next, calculate the total traffic potential for each traffic segment by landing page like below:
- TOFU TP = 40,000
- MOFU TP = 5,000
- BOFU TP = 1,000
Now, you are going to calculate the lead conversion rate for each traffic segment.
If you have goals set up in Google Analytics, this shouldn’t be too difficult.
- CR = Conversion Rate
- TOFU Lead CR = 0.1%
- MOFU Lead CR = 1%
- BOFU Lead CR = 5%
If you don't have any pages ranking yet, you're going to have to calculate this using back-of-the-envelope math. You could use a generic 2% calculated via a study done by Wordstream for your BOFU Lead CR, and then you could assume a ~75% reduction in conversion rate for each level up the funnel like below:
- TOFU Lead CR = 0.125%
- MOFU Lead CR = 0.5%
- BOFU Lead CR = 2%
Now, calculate your lead-to-sale percentage. Here's the formula:

For our example, lead to sale (L-S) = 15%.
If you don’t have any data available to you, look up industry averages to get a range.
Next, calculate your average revenue per sale:

Let’s say we make an average of $1,000 per sale (if you have lifetime value (LTV), use that instead).
Next, calculate the total leads per month:

OR
= (40,000 × 0.1%) + (5,000 × 1%) + (1,000 × 5%) = 140Now apply your L-S number to your total leads to get your total sales.
Total Leads Per Month × L-S = Sales Per Month
= 140 × 15% = 21
Multiply your sales per month by your average revenue per sale to get revenue per month:
RPS × Sales = Revenue Per Month
= $1,000 × 21 = $21,000
Finally, use the following formula to calculate RPV:
Revenue From Organic Sessions / Organic Sessions
= $21,000 / 46,000 = $0.46
Use Fermi decomposition to determine your upper and lower bounds and then add these numbers to cell C10 and C12:
Step 3: Determine How Many Links You Need to Close the Domain Authority Gap
Now, you are going to want to determine how many backlinks you need to build to close the domain authority gap between you and your competitors.
We’re assuming that you will build the links you need to close the domain authority gap to the right pages (i.e., pages that need backlinks to rank) AND that you use internal links to pass link equity to the pages that need it.
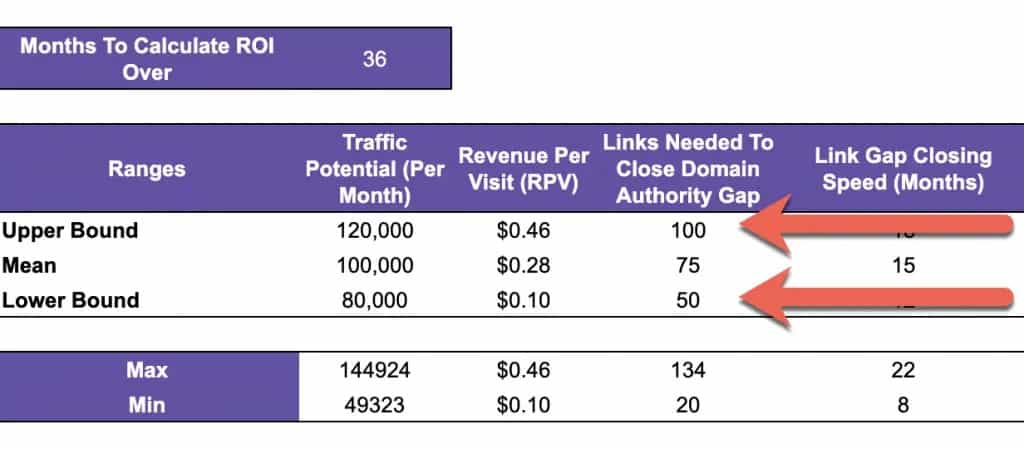
Once you determine the upper and lower bounds for how many links you need to build, enter those values into cells D10 and D12:
Step 4: Choose How Fast You Plan to Close the Link Gap
For this step, all you have to do is choose how fast you want to close the domain authority gap.
You should be aware of two factors when making this decision:
- What is your budget for backlinks each month?
- Do you have any limitations on how many links you can acquire each month?
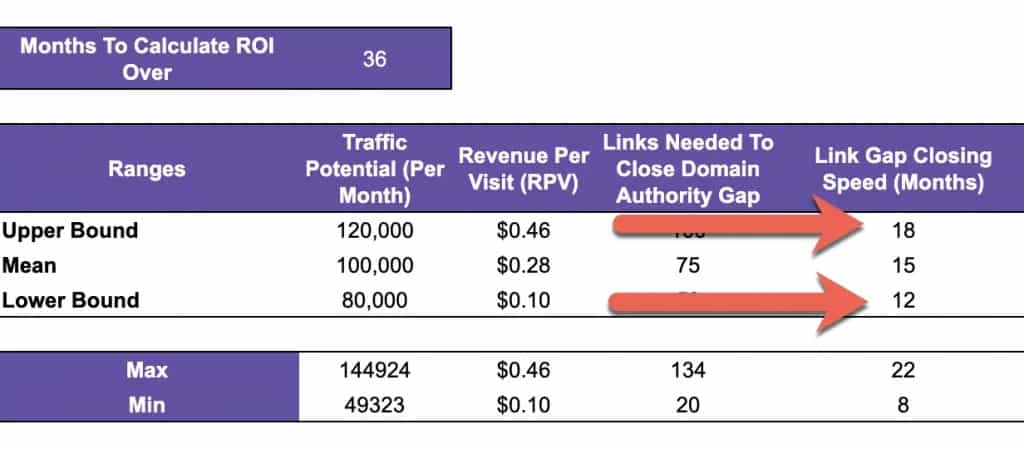
Once you have the upper and lower bounds, enter the values into cells E10 and E12:
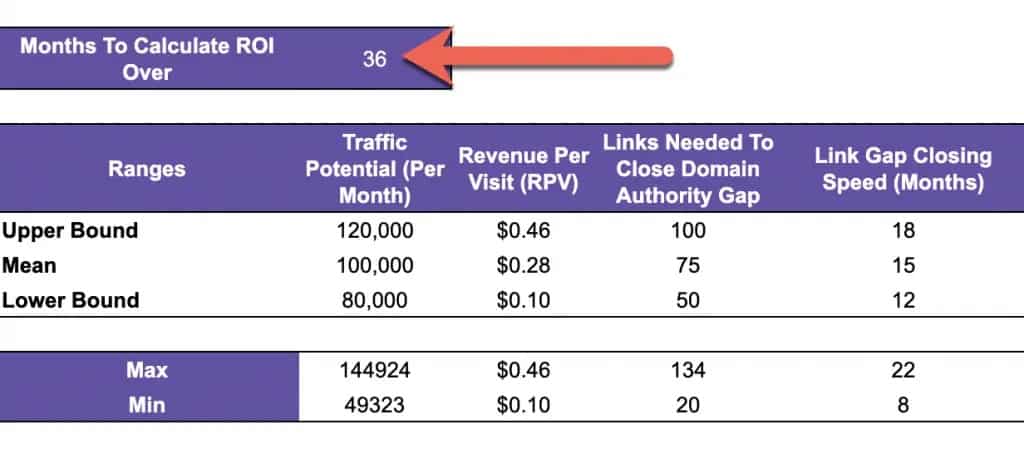
Step 5: Choose the Months You Want to Calculate ROI Over
Remember the assumption we made above?
This is where it comes into play.
Using the template, input the number of months you want to calculate ROI over.
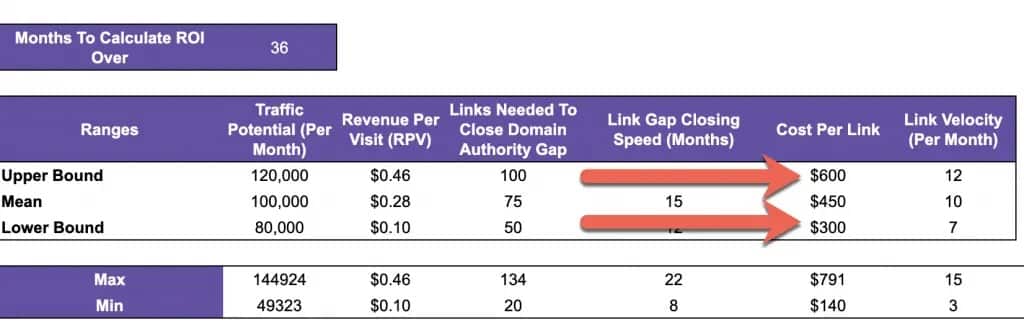
Step 6: Calculate Your Cost Per Link
Now, we need to calculate the cost per link.
The formula is simple if you’ve already done link building in the past:
- Link Building Expenses / # of Links Built = Cost Per Link
Here are some examples of what you’d want to include in your numerator:
- Tool cost (Ahrefs, Majestic, Mailshake, Pitchbox, etc.)
- People cost (link prospectors, outreach manager, etc.)
- Content cost (if guest posting)
- Link cost (if you plan on buying links or paying for “placement fees”)
If you haven’t previously done link building, you have three options:
- Use an arbitrarily high range. I recommend $400 - $800
- Talk to a link building agency who could do link building for you and ask them what their range is for cost per link.
- Hire us to teach your team (or build and train a team for you) how to build links. After 3 months of link building, use the data to calculate your cost per link.
Once you have the upper and lower bounds, enter the values into cells F10 and F12:
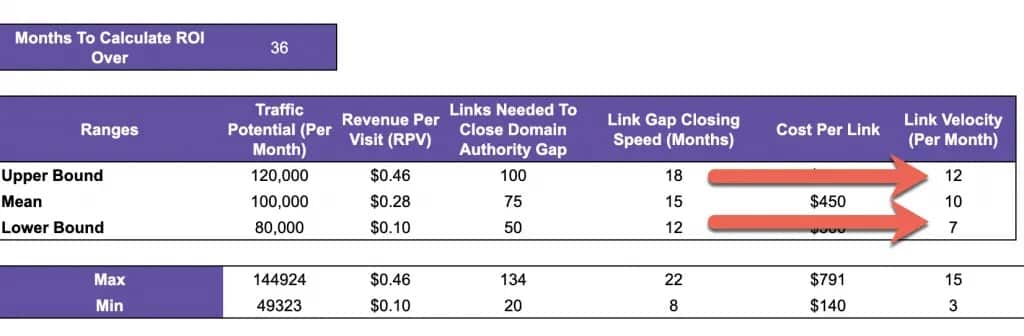
Step 7: Determine Your Link Velocity
Once you have the upper and lower bounds, enter the values into cells G10 and G12:
Step 8: Understanding the ROI Formula
Again, the formula for calculating the ROI on link building is:
- Net Return on Link Building / Cost of Link Building
Here’s the formula broken down using the inputs we just found:
- TP = Traffic Potential (per month)
- RPV = Revenue Per Visit
- LG = Links Needed To Close Domain Authority Gap
- M = Months To Calculate ROI Over
- C = Link Gap Closing Speed (Months)
- LV = Link Velocity (Per Month)
- CPL = Cost Per Link
[ ((M - C) * (TP * RPV)) - ((LG * CPL) + (C * LV * CPL) + (M - C) * LV * CPL) ] / [ (LG * CPL) + (C * LV * CPL) + (M - C) * LV * CPL ]After you plug in your last input, the Monte Carlo simulation will run 10,000 scenarios.
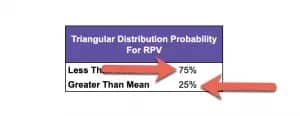
The only input that isn’t normally distributed in this Monte Carlo simulation is Revenue Per Visit (RPV).
Because RPV can’t be negative and is the input with the highest degree of uncertainty, I prefer making this input a triangular distribution that is weighted more towards the lower end, but where the lower bound is the lowest possible value used in the simulation.
If you want to change the triangular distribution, use cells J10 and J11:
Step 9: Analyzing the Results
At the top of the Google sheet, you’ll see the following summary:
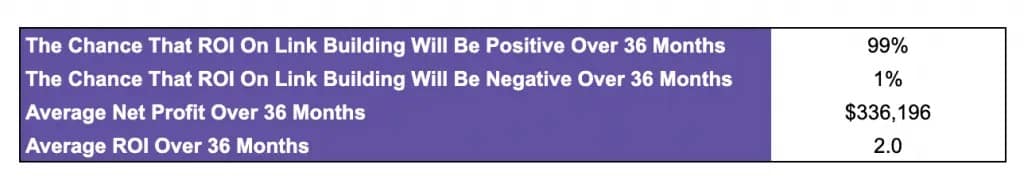
As long as cell E5 is greater than 0, I would feel comfortable investing in link building. Remember, we are probably really underestimating the ROI on link building because of the assumption we’re making (i.e. we won’t start generating revenue until we close the link gap).
You’ll also see the following section in the Google Sheet:
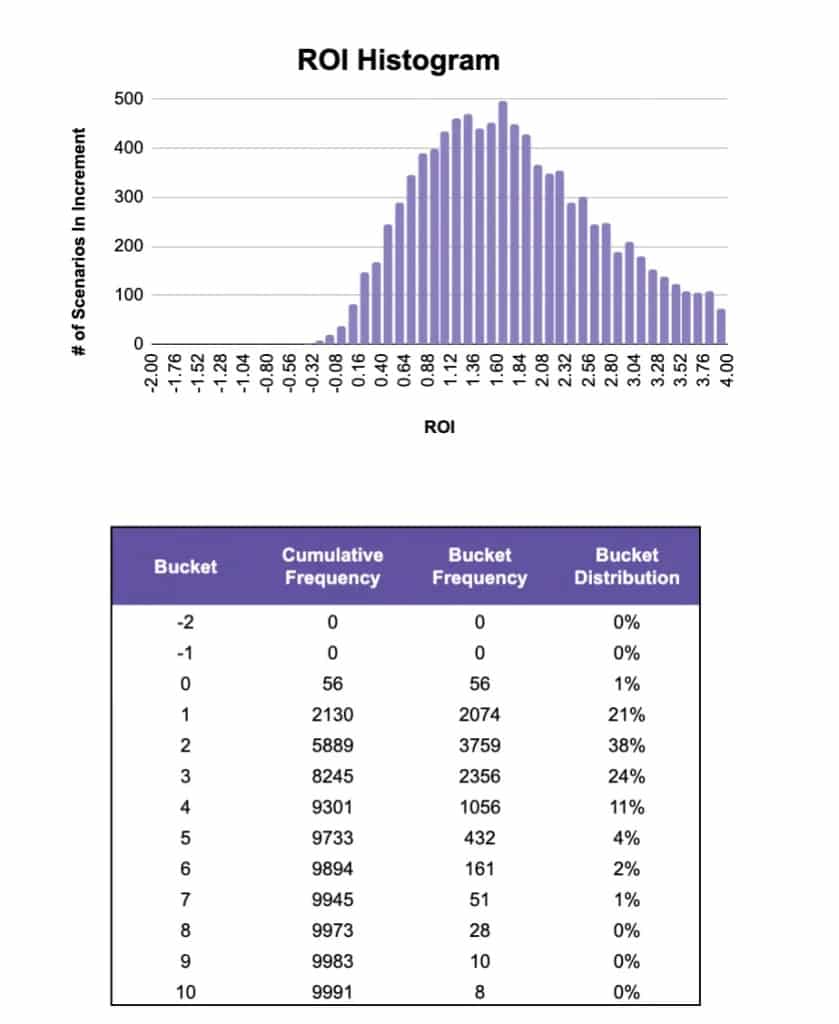
If you look at the Bucket Distribution column, this shows the probability of link building ROI falling into each bucket.
For example, bucket 0 means that there is a 1% chance that the ROI will be between -1 and 0. Bucket 1 means that there is a 21% chance that link building ROI will fall between 0 and 1, etc.
Final Thoughts
When it comes to acquiring organic traffic and SEO, there are no guarantees.
At the end of the day, you’re dependent on a search engine that you have zero control over.
That doesn’t mean you shouldn’t invest. You’d be missing out on a massive upside.
It also doesn’t mean you should be blindly investing just because you know there is a massive upside. If you do that, you’re exposing yourself to a ton of risk and uncertainty.
The best way to reduce risk and uncertainty is to use business intelligence, analytics, and measurement.
The Monte Carlo simulation paired with Fermi decomposition is a perfect example of this.